Your record
Reading your own statistics
Your figures for the reporting period, on the dashboard and on your profile.
Where to find it
Menu My Dashboard
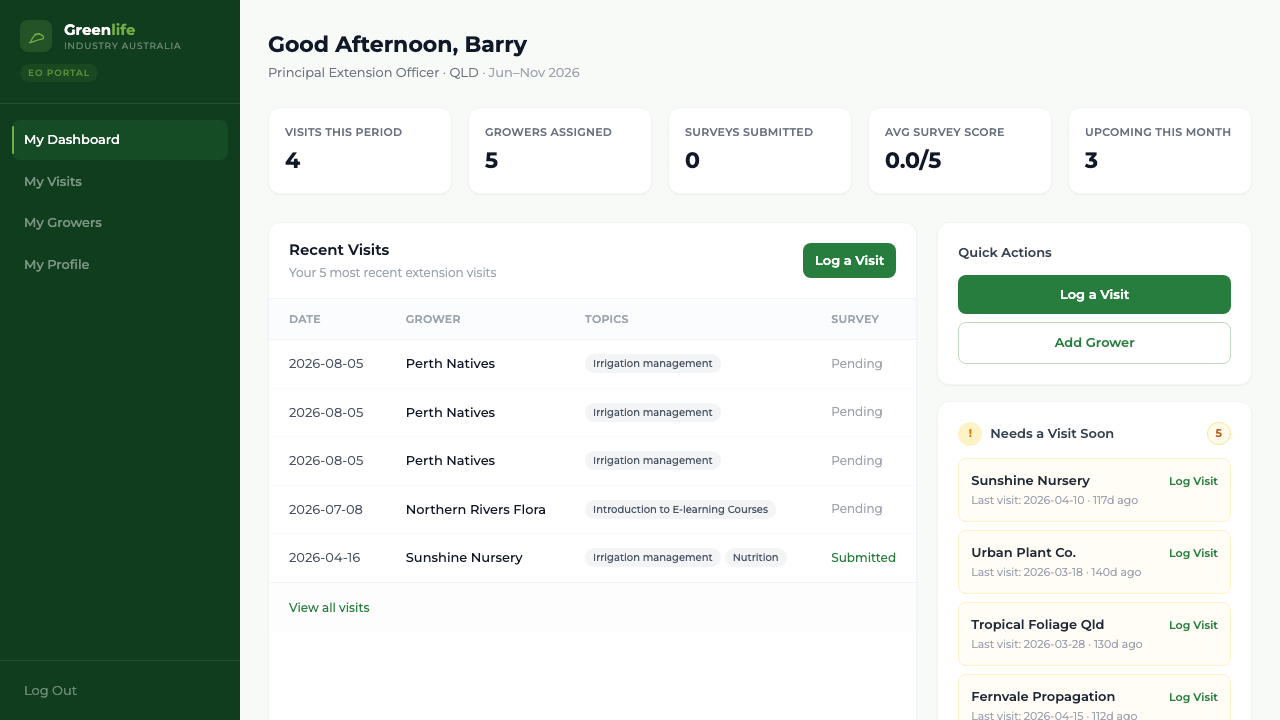
Your dashboard opens with five figures: Visits This Period, Growers Assigned, Surveys Submitted, Avg Survey Score and Upcoming This Month. The first four cover the reporting period named under the greeting; the last counts what you have scheduled in the current calendar month.
Steps
- 1 Select My Dashboard for the five headline figures.
- 2 Select My Profile for the fuller set under Period Statistics: visits this period, growers assigned, surveys submitted, response rate, average survey score, and how many of your growers are overdue a visit.
What you'll see
You can see your own contribution to the period without asking anyone, and how many of your visits are producing survey responses.
Good to know
These figures are yours alone — you cannot see another officer's, and there are no program-wide reports in the officer portal. Ask your administrator if you want to know how the program as a whole is tracking.