Getting started
What the platform does and who does what
An overview of the platform, the two kinds of user, and how work flows from a field visit to the milestone report.
Where to find it
Applies everywhere
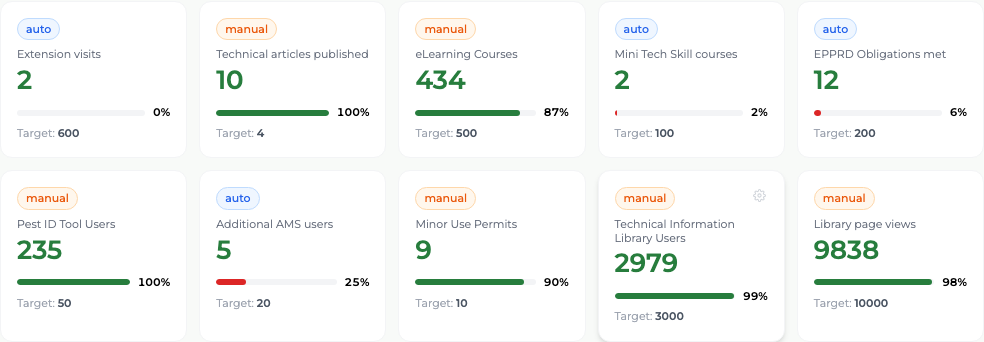
The platform records what GIA's Extension Officers do in the field and turns it into the figures GIA reports to Hort Innovation. It replaces the spreadsheets and manual compilation that used to sit between the two.
There are two kinds of user, and they see different portals:
- Administrator
- Sets up reporting periods and targets, manages officers and growers, maintains the activity menus, and produces the reporting figures. Cannot log visits or fill in surveys.
- Extension Officer
- Logs visits, plans upcoming visits, runs the grower feedback survey, and maintains their own grower list. Sees only their own growers and visits.
Work flows in one direction. An officer logs a visit and the grower answers the eight survey questions; the platform totals those records against the active reporting period; the administrator reads the totals on the dashboard and exports them for the milestone report.
What you'll see
Nothing is entered twice. Every figure an administrator reports traces back to a visit record an officer created, and can be broken down by officer, state and month.
Good to know
The admin and officer portals are websites — there is nothing to install for those. Officers use the same officer portal on a laptop and on a phone browser. For field work with unreliable signal, officers also have the GIA Field app (local native install); the websites themselves are not offline apps.