Surveys and consent
Reading the survey results
The Knowledge, Skills and Attitudes gauges, submission rate, per-question scores and state coverage.
Where to find it
Sidebar Surveys & Reports
Steps
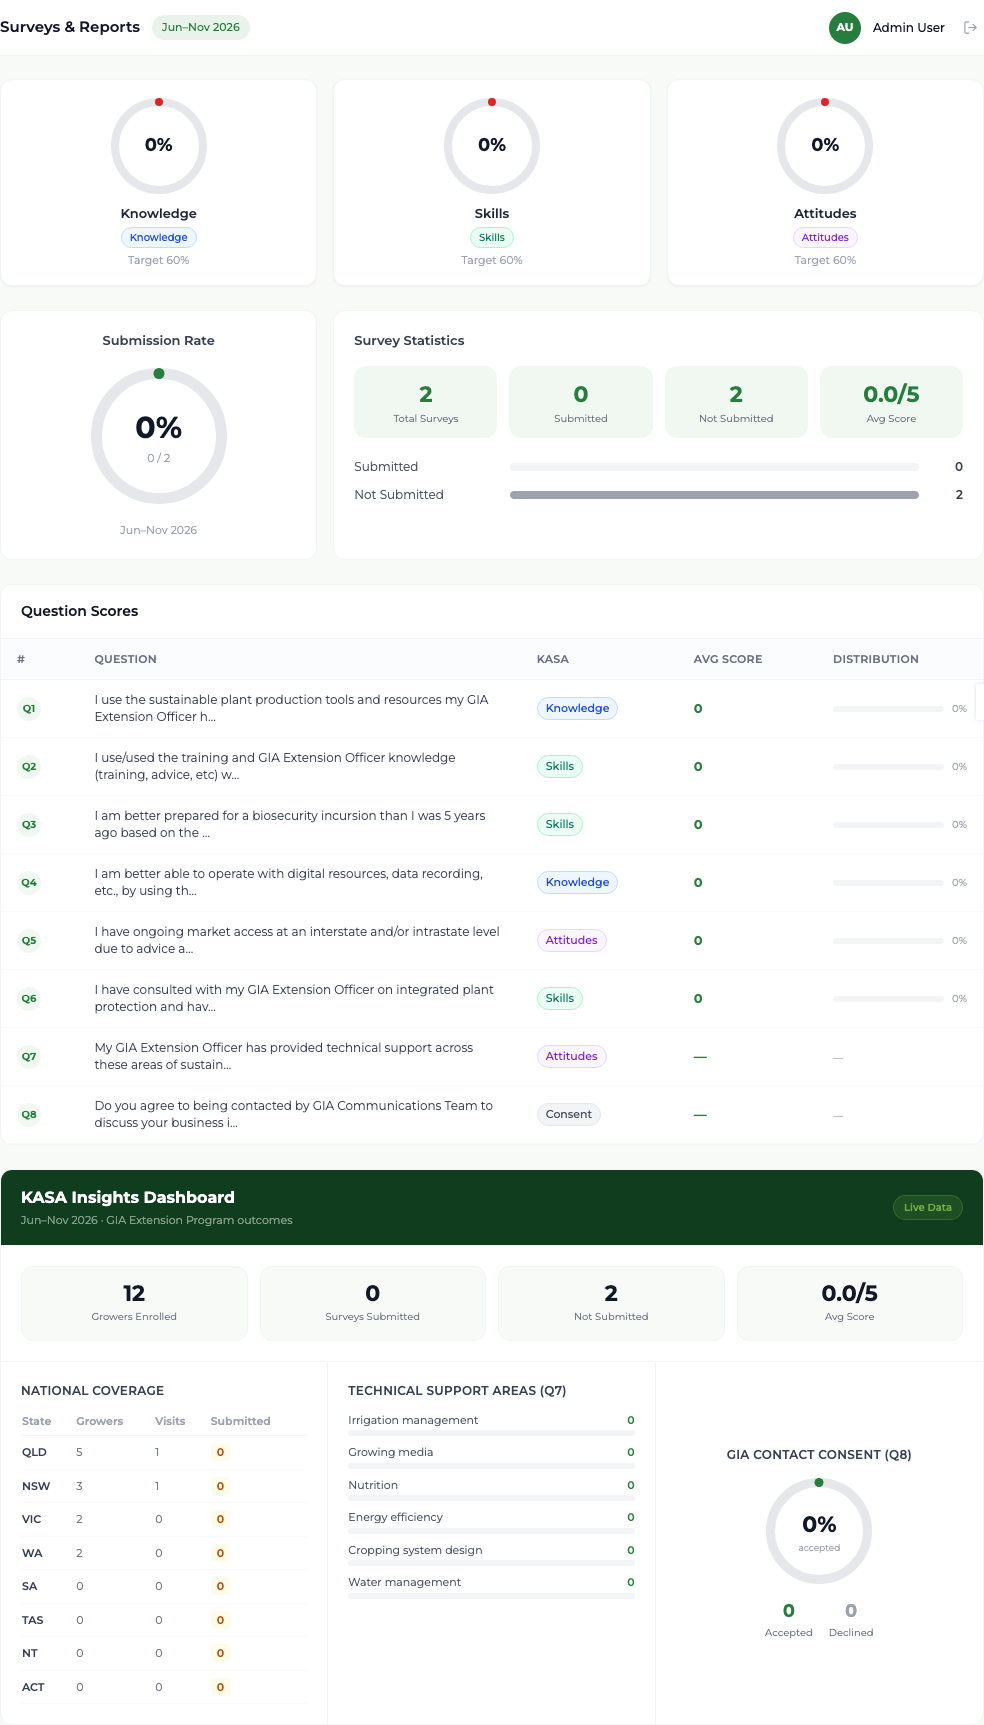
- 1 Select Surveys & Reports in the sidebar. The heading names the active period.
- 2 Read the three gauges — Knowledge, Skills and Attitudes — each showing a percentage against its target.
- 3 Read the Submission Rate ring and the Survey Statistics beside it: total surveys, submitted, not submitted and average score.
- 4 Scroll to Question Scores for the average and the spread of answers question by question.
- 5 In the KASA Insights panel, read National Coverage for all eight states and territories, the Q7 technical-support areas, and the consent split from Q8.
The three gauges come from the grower answers to Q1 to Q6, grouped by whether each question measures knowledge, skills or attitudes. The submission rate is how many completed visits produced a survey.
What you'll see
You can state how each gauge was calculated and how many responses it rests on, and you can see coverage across every state and territory rather than only the busy ones.
Good to know
Questions that are not scored on the agree/disagree scale show a dash in the Avg Score column — that is correct, not a fault. Every figure here is scoped to the active reporting period.