Reporting
Producing the figures for a period
Read every reportable number for a period from one screen, ready to transcribe into the Hort Innovation template.
Where to find it
Sidebar Reports
Before you start
The Hort Innovation Word template open beside you. The platform supplies the figures; the narrative is yours.
Steps
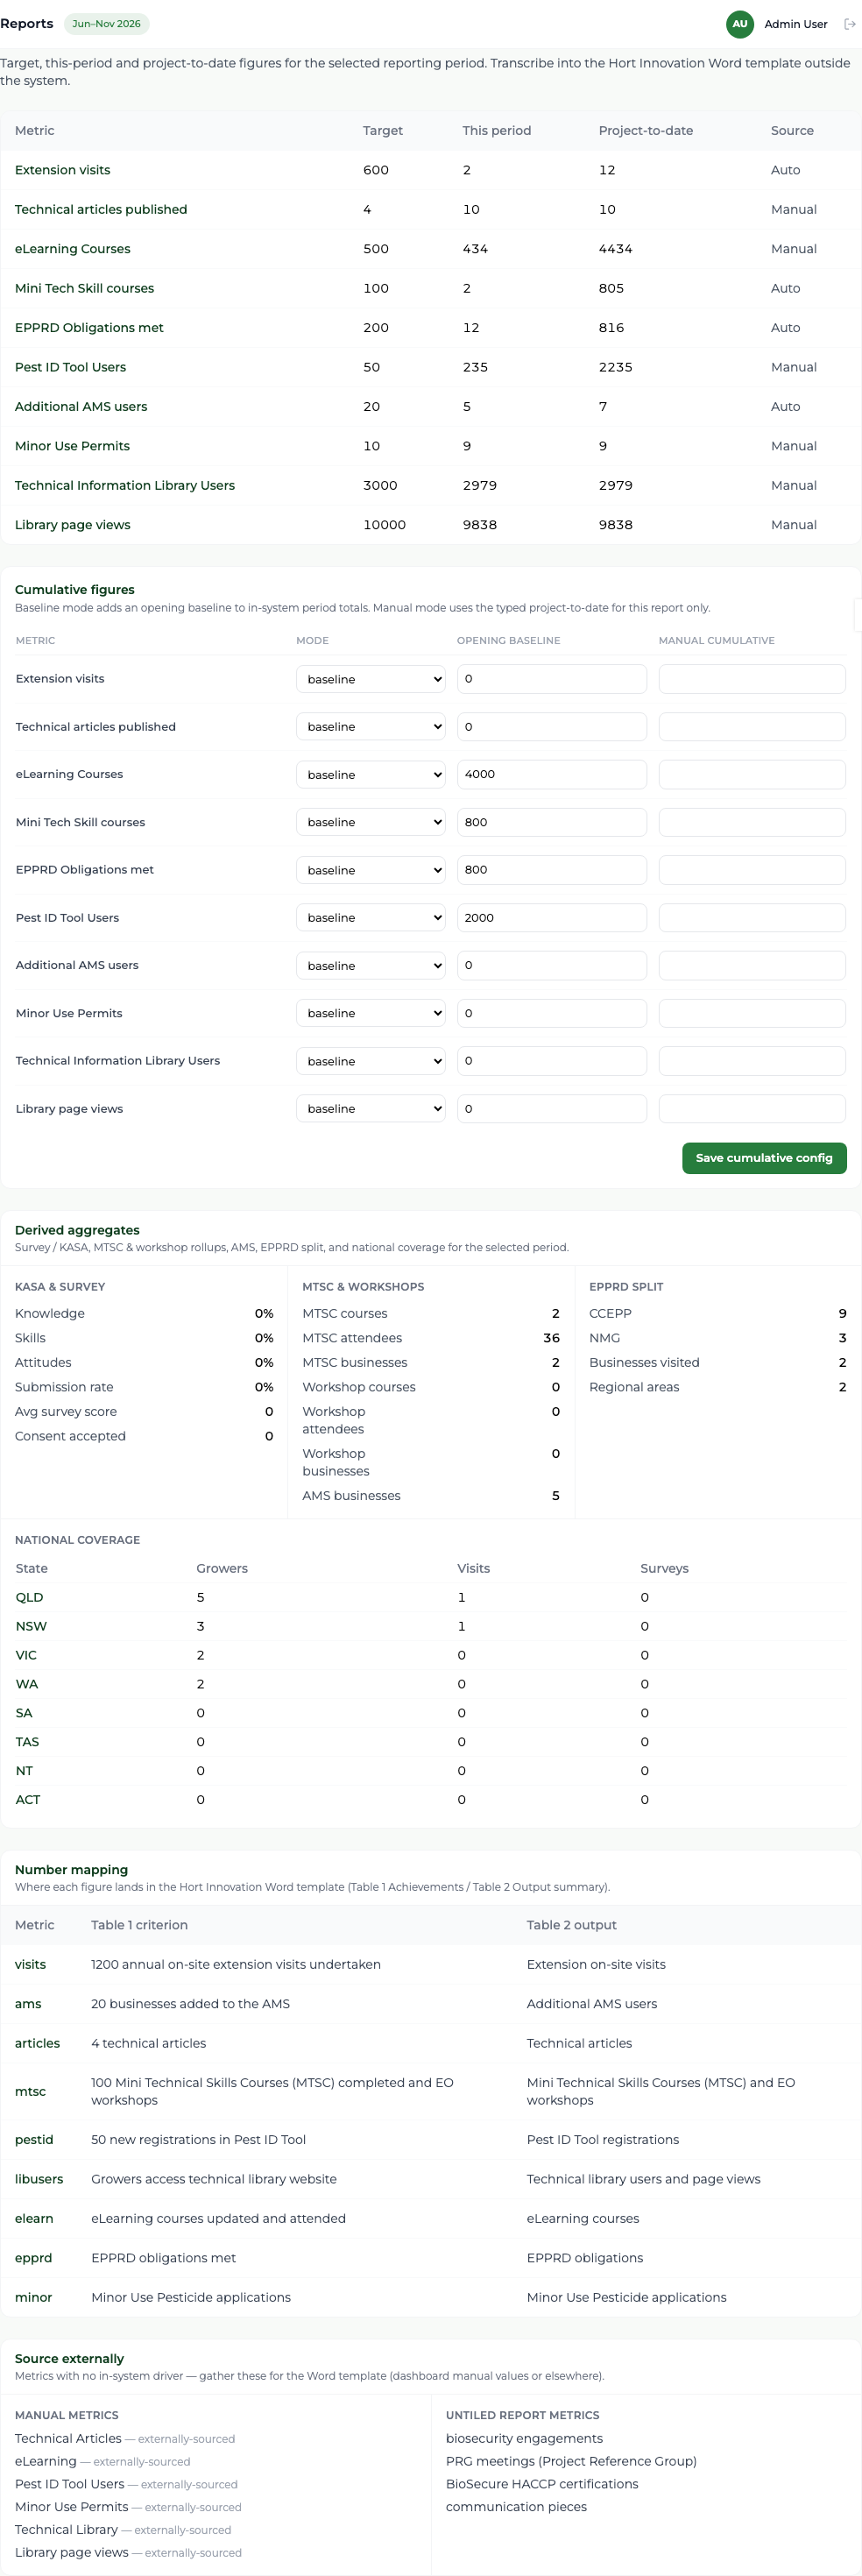
- 1 Select Reports in the sidebar. The screen is headed "Milestone Figures".
- 2 Choose the period you are reporting on in the period picker. It defaults to the active period and the whole screen re-scopes when you change it.
- 3 Read the figures table: each metric with its target, its figure for the period, its project-to-date figure, and where the figure came from.
- 4 Read Derived aggregates below it — the survey and gauge figures, Mini Tech Skills courses and workshops broken into courses, attendees and businesses, the AMS business count, the EPPRD split, businesses visited, regional areas, and coverage by state.
- 5 Use Number mapping to see which figure belongs in which Hort Innovation criterion and output row.
- 6 Export what you need, then transcribe into the Word template.
What you'll see
Every cell of the report can be filled from this screen, or from a register the screen explicitly tells you to go and fetch. Nothing is left blank by accident, and the same period read twice gives the same numbers.
Good to know
Reading a different period here does not change the active period, so it is safe to do at any time. The platform does not write the report for you: there is no report builder and no Word or PDF output — transcription into the template is a deliberate manual step.