The dashboard
Reading the Extension Activity Log
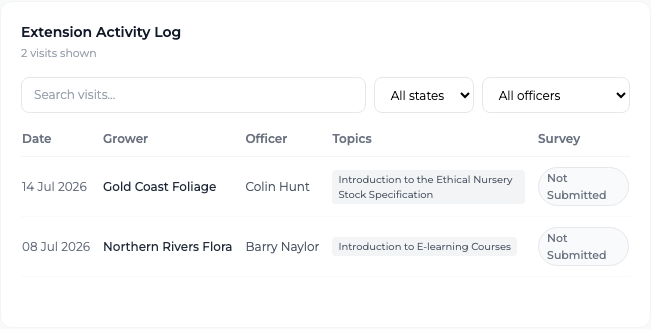
See the individual completed visits behind the numbers, and filter them by grower, state or officer.
Where to find it
Sidebar Dashboard Extension Activity Log
Steps
- 1 Open the Dashboard and scroll to the Extension Activity Log.
- 2 Read the entries. Each row shows the date, the grower, the officer, up to two topic chips (with "+N more" when there were others), and whether the survey was Submitted or Not Submitted.
- 3 Type a grower or officer name into the search box to narrow the list.
- 4 Use the state and officer dropdowns to narrow it further.
- 5 Check the count above the list — it reads "N visits shown".
What you'll see
You can answer "what happened recently?" from this panel alone, and reconcile the Extension visits tile against the individual visits that produced it.
Good to know
The log shows completed visits inside the active period only — planned visits are not listed here. For scheduled visits, use the Visits screen or its calendar. Each grower also has its own Extension Activity Log on its record.